Štítek pluginu: profiling
-
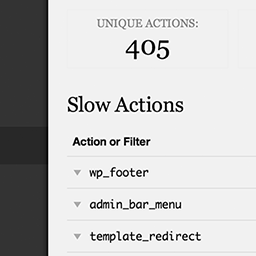
Debug Bar Slow Actions
Easily find out which actions and filters are the slowest during a page load.
-

Debugger
You can use this plugin to manually log data or to capture logging on WordPress actions. You can capture load time, memory, backrace, data dumps, urls …
-
-

WPDB Profiling
This plugin will give you the total number of queries to the db per page, as well as the total time it took to render those queries out to the page.
-

MySQL Profiler
Displays a list of each page's SQL queries and the functions calling them that can be searched and sorted by time, type, etc.
-
-

Block Weight Inspector
See which blocks load which CSS/JS assets on a page and estimate their weight.
-

CodeTelemetryLab Admin Performance Inspector
Profile your WordPress admin performance. Identify slow plugins, database queries, hook execution times, and memory usage from one clean dashboard.
-
-

Qaiyo Web Performance Surgeon
Diagnose what actually slows your site down — file- and function-level attribution of SQL, hooks, HTTP and assets, measured on a real visitor render.
-

liaison site health monitor
Developer-focused WordPress diagnostic plugin using WordPress core SAVEQUERIES for site health metrics and slow query profiling.
-

Sysadmin Total Suite
Core integrity checks, load-time profiling, user review, performance diagnostics and AI bot blocking in a single admin panel.
-

HookTrace – Trace Hooks with Precision
Cross-Plugin Debug & Trace Recorder – Records and visualizes hook execution order for WordPress developers.